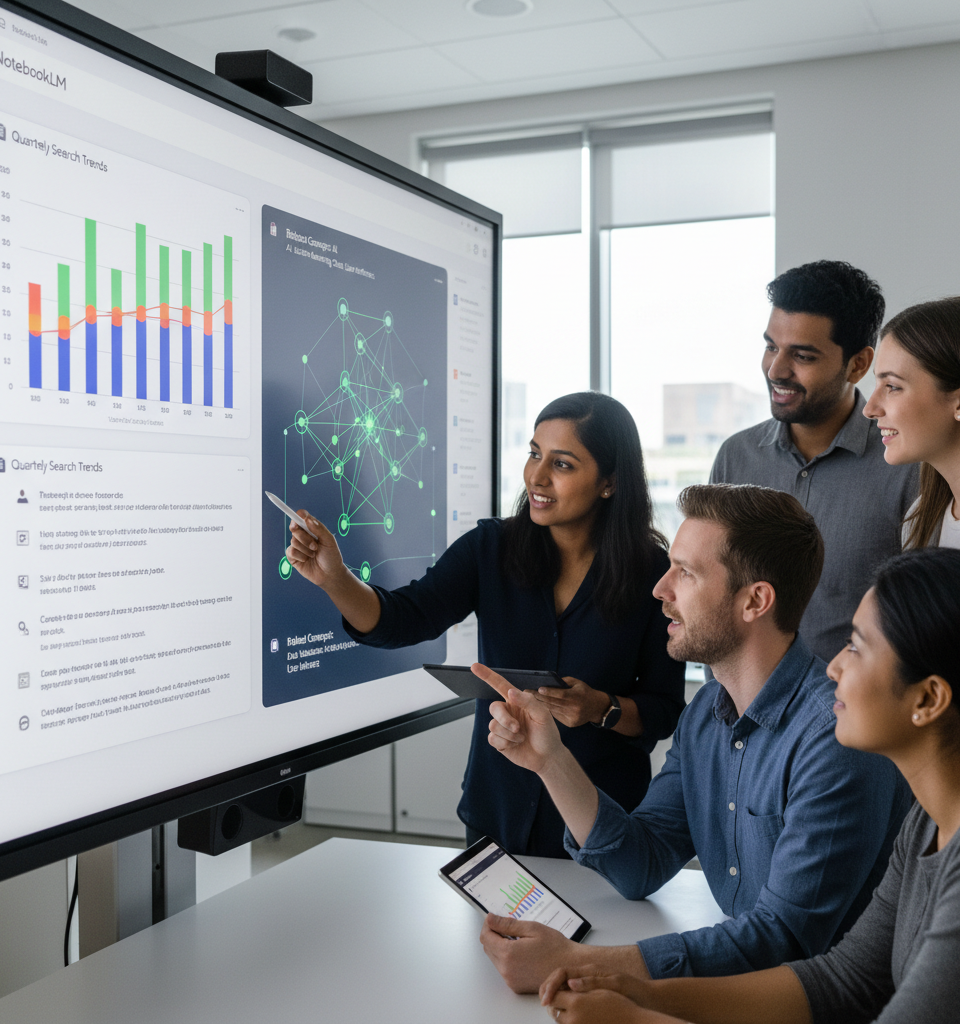
Google's experimental artificial intelligence-powered research tool, NotebookLM, is reportedly preparing to roll out advanced features that will allow users to generate interactive charts, graphs, and diagrams directly from their uploaded source documents. This prospective development, first hinted at through leaked screenshots and early access program user reports, positions NotebookLM to evolve from a text-centric analysis platform into a more comprehensive, visually-driven research assistant. The anticipated update aims to streamline the research process, enabling a deeper and more intuitive understanding of complex data and interconnected ideas by allowing users to 'ask' the AI to visualize relationships and trends within their uploaded content.
The Evolution of Research: Bridging Text and Visual Understanding
This potential upgrade arrives at a pivotal moment in the landscape of AI-assisted research and knowledge management. For decades, researchers have grappled with the cognitive load of synthesizing vast amounts of text-based information. While tools like NotebookLM have already made strides in summarizing, querying, and linking documents, the addition of visual data generation marks a significant leap. It addresses a core need for many users to not just understand discrete facts but to discern patterns, correlations, and anomalies often hidden within dense textual data. This move reflects a broader industry trend towards multimodal AI, where systems can process and generate information across various formats, including text, images, and soon, interactive visualizations.
Unpacking the Prospective Features
While Google has yet to officially confirm these features, reports suggest NotebookLM could allow users to prompt the AI to create various types of visualizations based on the content of their uploaded PDFs, Google Docs, or web articles. For instance, a user analyzing market reports might ask NotebookLM to "show me a bar chart comparing sales figures of product X across regions Y and Z from 2021-2023," or a historian might request a timeline illustrating key events and their relationships. The 'interactive' aspect implies that users will be able to click on elements within these visualizations to delve deeper into the underlying source material, offering a seamless transition between summary and detail. This integration of visual analytics directly within the research environment could significantly reduce the time and effort traditionally spent manually extracting and visualizing data.
Industry Impact and Competitive Landscape
The introduction of interactive visual capabilities within NotebookLM could have far-reaching implications across several sectors, including academia, journalism, market research, and corporate strategy. For businesses, this means faster insights from competitive analyses, financial reports, and customer feedback. Academics could accelerate literature reviews and thesis development. Journalists could quickly identify trends and create compelling visual narratives. This move also intensifies competition with existing data visualization platforms and enterprise knowledge management systems. Companies like Tableau, Power BI, and specialized AI tools that offer summarization and data extraction will need to innovate further to maintain their edge against a more versatile AI research assistant integrated directly into Google's ecosystem. The potential for seamless integration with other Google services, such as Google Sheets or Google Slides, could also create a powerful, integrated workflow for users.
Expert Perspectives on AI-Driven Visual Analytics
Industry analysts are keenly observing Google’s movements in this space. Dr. Elena Petrova, a leading expert in AI and human-computer interaction, commented, "If implemented effectively, this could be a game-changer. The democratisation of complex data visualization, making it accessible to non-data scientists, will unlock new levels of insight and accelerate discovery across domains. The challenge, however, will be ensuring the AI accurately interprets user intent and does not generate misleading visualizations from ambiguous data." Others note that the quality of the AI's output will be paramount, emphasizing the need for robust error checking and transparency in how visualizations are generated. The ethical implications of AI-generated visuals, particularly in fields requiring high accuracy like scientific research or legal analysis, will also be a key discussion point.
The Road Ahead: Future Implications and Development
Looking forward, the integration of interactive visuals is likely just one step in NotebookLM's journey towards becoming an indispensable AI research partner. Future developments could include the ability to generate entirely new types of visual content, such as concept maps that dynamically adjust as new information is added, or even predictive visualizations based on incomplete data. The potential for NotebookLM to learn user preferences for visualization styles and automatically suggest insights based on reading habits also exists. As Google continues to refine its Gemini large language model, the accuracy and sophistication of NotebookLM's visual generation capabilities are expected to improve dramatically, solidifying its position as a frontrunner in the AI-powered knowledge management space and fundamentally altering how we interact with information.